Kubernetes has three probes to track containers’ health: Liveness, Readines, and Startup probes. In this article, you’ll understand these probes and their differences and, most importantly, learn how to implement them practically in your projects.
Here’s a quick summary for you.
Table of Contents
- Liveness Probes
- Readiness Probes
- Startup Probes
- Difference between Readiness and Startup probes
- Difference between Liveness and Readiness Probes
- Notes
- Examples of Liveness Probes
- Example of Readiness Probe
Liveness Probes
These probes check if the container is running as expected, meaning that the application inside the container is functioning correctly and not experiencing any critical issues. This could include scenarios such as:
- The application is stuck in an infinite loop or deadlock.
- The application is not responsive.
If a liveness probe fails, the kubelet terminates the container and initiates a restart according to the Pod’s restartPolicy.
Readiness Probes
These probes check if the container is ready to serve traffic. They ensure the container has finished all necessary startup tasks and can handle incoming requests.
When a readiness probe fails, the Endpoints controller removes the Pod’s IP address from the Service’s endpoints, stopping the traffic sent to the unhealthy container.
Readiness probes are essential for applications that take time to start up or have external dependencies.
Startup Probes
These probes check if the container has started successfully. They are handy for containers that have a lengthy startup process.
The kubelet executes the startup probe during the container’s initialization phase. Once the startup probe succeeds, Kubernetes only begins running the liveness and readiness probes. If a startup probe fails, the kubelet terminates the container and restarts it according to the Pod’s restartPolicy.
Startup probes help prevent premature liveness or readiness probe failures during the container startup phase.
Difference between Readiness and Startup probes
Readiness probes determine if the container is ready to serve traffic “throughout its lifetime”. In contrast, startup probes ensure the container “has started successfully“ before other probes monitor its health.
Difference between Liveness and Readiness Probes
To understand this difference, let’s consider the below scenario.
Imagine you have a web application running in the container. This application relies on a third-party API to function correctly.
Liveness Probe Scenario
- After running for several hours, your application experiences a slowdown due to a bug in the code.
- This slowdown causes your application to become unresponsive and unable to handle new requests.
- The liveness probe detects that the application is not responding and triggers the container restart.
- After the restart, the application recovers and functions normally.
Readiness Probe Scenario
- Your application runs normally, but the third-party API it depends on becomes unavailable.
- The readiness probe detects that the application cannot reach the third-party API and stops sending traffic to the container.
- Kubernetes continues to run the container but does not send any new requests until the third-party API becomes available again.
- Once the third-party API is back online, the readiness probe succeeds, and Kubernetes resumes sending traffic to the container.
The key difference is that liveness probes monitor the internal health of your application and will restart the container if issues are detected. In contrast, readiness probes monitor the readiness of your application to serve traffic without restarting the container.
Enough theory. Let’s implement what we learned so far.

Notes
Repository
- To follow the examples in this guide, clone the GitHub repository.
> git clone https://github.com/decisivedevops/blog-resources.git

> cd blog-resources/k8s/probes
Building Docker Images
- All the examples have their respective Dockerfiles for container image creation.
- I am using a Kind cluster, so I will build the images locally and push them to the Kind cluster node.
- Due to this, a local image is used in
deployment.yaml. To ensure K8S does not pull the image from an upstream registry like Docker, I am configuringimagePullPolicy: Never. You can learn more aboutimagePullPolicyhere.
Terminal
- During demos, you can use a screen multiplexer such as Tmux to get a single-view layout for all the different
kubectlcommands. - You can also use multiple terminal windows/ panes.
Examples of Liveness Probes
Example 1: HTTP GET Liveness Probe
In this example, we’ll create a simple Node.js application that exposes an endpoint for health checks and configure a liveness probe using HTTP GET.
- Change to
liveness-probe-exampledirectory.
cd liveness-probe-example- This
app.jsapplication has two endpoints:/healthz: Returns an HTTP 200 OK response when the application is healthy and an HTTP 500 Internal Server Error response when it’s unhealthy./make-unhealthy: Simulates an unhealthy state by setting thehealthyvariable tofalse.
- In
deployment.yaml, we configure an HTTP GET liveness probe that checks the/healthzendpoint every 5 seconds, starting after an initial delay of 5 seconds. - Apply the deployment.
kubectl apply -f deployment.yaml- Verify that the Pod is running:
> POD=$(kubectl get pod -l app=liveness-probe-example -o jsonpath="{.items[0].metadata.name}")

> kubectl get pod/${POD}- Wait until you see the Pod in the “Running” state.
- Now, we can simulate an unhealthy state by requesting the
/make-unhealthyendpoint.
kubectl exec -it $POD -- curl http://localhost:3000/make-unhealthy- Watch the pod events:
kubectl events --watch --for Pod/$POD- You’ll notice that Kubernetes restarted the Pod due to the liveness probe detecting the unhealthy state.
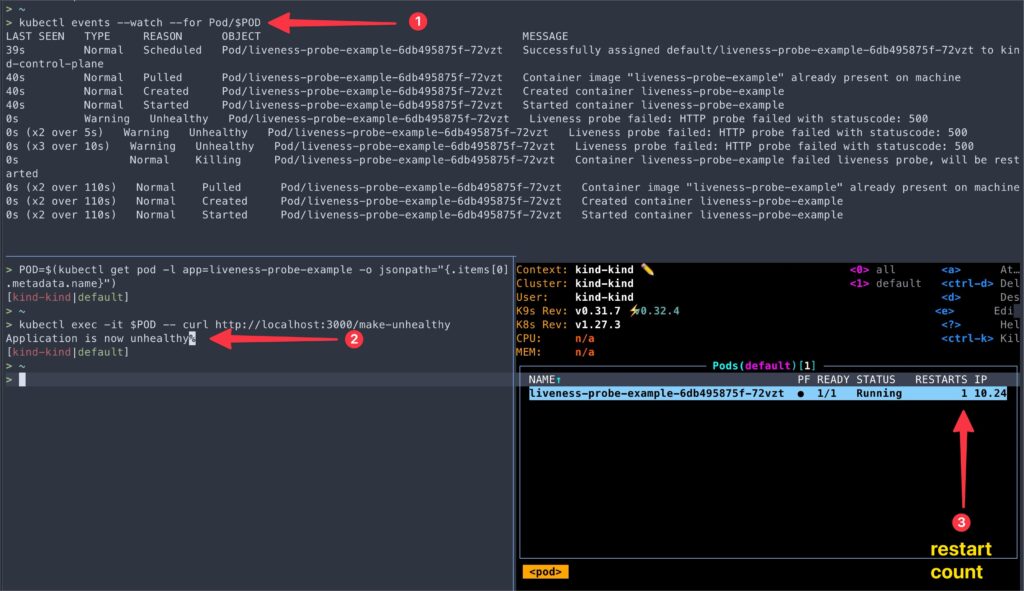
This example demonstrates how to configure an HTTP GET liveness probe and how Kubernetes responds to a failing liveness probe by restarting the container.
In the following example, we’ll explore a different type of liveness probe using a TCP Socket.
Example 2: TCP Socket Liveness Probe
In this example, we’ll create a simple Python application that listens on a TCP port and configure a liveness probe using a TCP Socket.
- Navigate to
tcp-liveness-probe-exampledirectory.
cd tcp-liveness-probe-exampleapp.pyPython script starts a TCP server that listens on port 8080 and accepts incoming connections. To simulate the code failure, we’ll close the socket connection after a few seconds onceapp.pyruns.- In
deployment.yaml, we configure a TCP Socket liveness probe that checks the container’s port 8080 every 5 seconds, starting after an initial delay of 5 seconds.
- Apply the deployment.
kubectl apply -f deployment.yaml- Verify that the Pod is running:
> POD=$(kubectl get pod -l app=tcp-liveness-probe-example -o jsonpath="{.items[0].metadata.name}")

> kubectl get pod/${POD}- Once the socket connection is closed, kubelet automatically restarts the container because the TCP Socket liveness probe detects the application no longer listens on the specified port.
kubectl events --watch --for Pod/$POD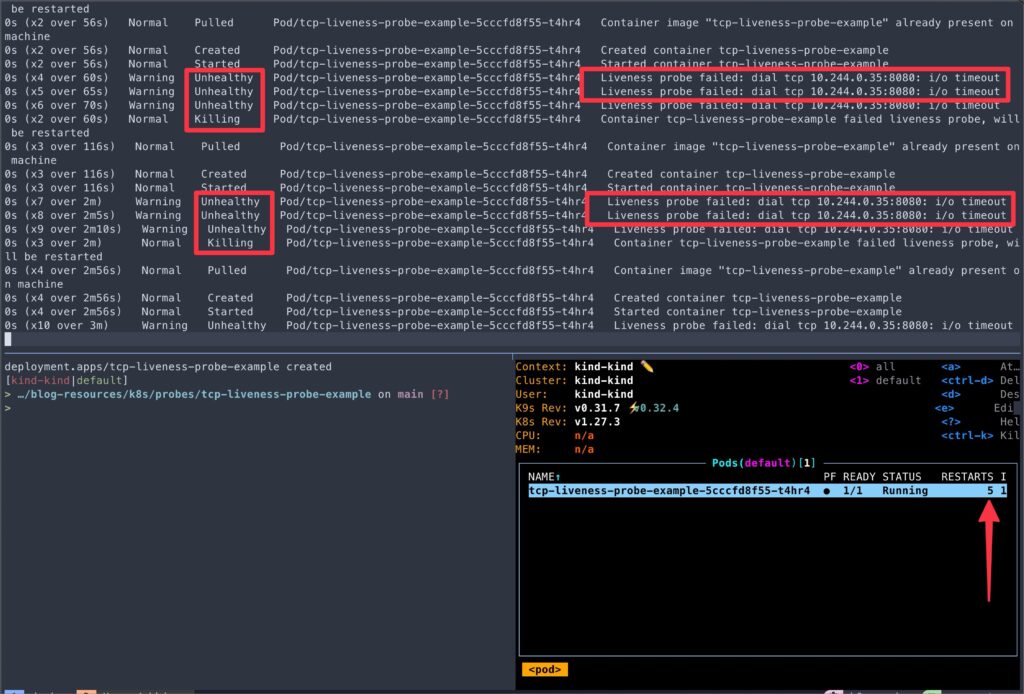
This example showcases how to configure a TCP Socket liveness probe and demonstrates Kubernetes’ ability to restart the container when the liveness probe fails.
In the following example, we’ll explore the Exec liveness probe, which executes a command inside the container to determine its health.
Example 3: Exec Liveness Probe
In this example, we’ll create a simple bash script that simulates an application and configure a liveness probe using the Exec probe type.
- Navigate to
exec-liveness-probe-exampledirectory.
cd exec-liveness-probe-exampleapp.shscript starts an application simulation, writes “I am healthy” to file/tmp/healthz, then runs a loop that counts to 59, echoing progress every 2 seconds. At the count of 10, it deletes/tmp/healthz.- In
deployment.yaml, we configure an Exec liveness probe that runs the commandif [ -f /tmp/healthz ]; then exit 0; else exit 1; fiinside the container every 5 seconds, starting after an initial delay of 10 seconds. - This conditional probe command checks if the file
/tmp/healthzexists. If it does, the script exits with a status code0indicating success. If the file does not exist, it exits with a status code1indicating failure. - The liveness probe fails if the command exits with a non-zero status code.
- Apply the deployment.
kubectl apply -f deployment.yaml- Verify that the Pod is running:
> POD=$(kubectl get pod -l app=exec-liveness-probe-example -o jsonpath="{.items[0].metadata.name}")

> kubectl get pod/${POD}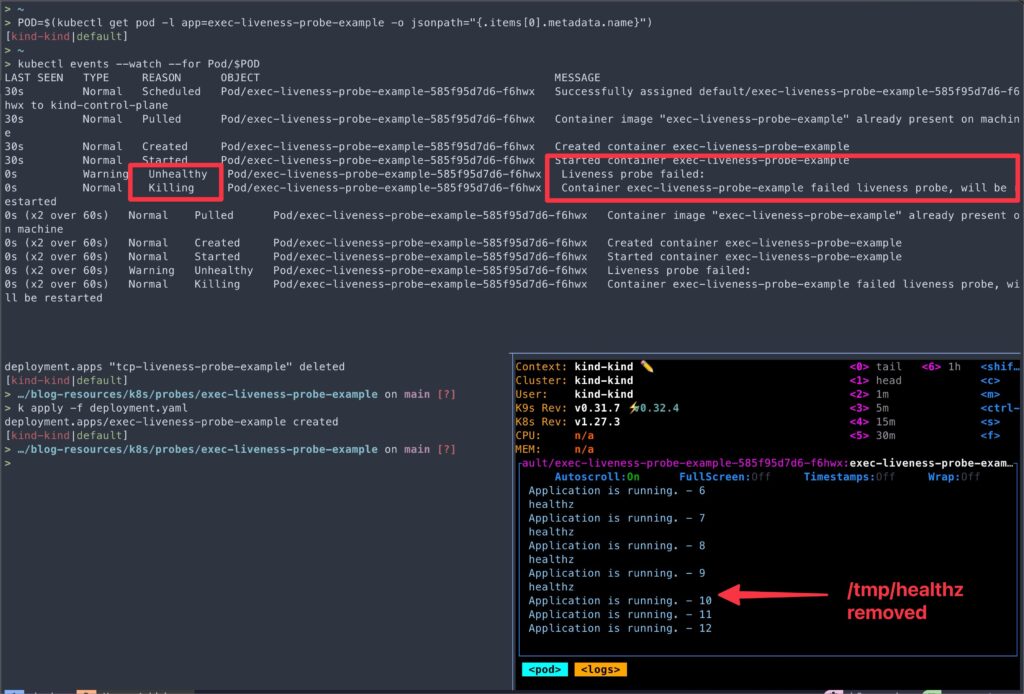
This example demonstrates how to configure an Exec liveness probe that executes a command inside the container to check the application’s health.
Above examples cover the three main types of liveness probes: HTTP GET, TCP Socket, and Exec. You can choose the appropriate probe type based on your application’s requirements and the specific health check mechanism you want to implement.
Example of Readiness Probe
Example 4: HTTP GET Readiness Probe
In this example, we’ll implement a simple Node.js app with a readiness probe that checks the connectivity to multiple external dependencies (MongoDB and Redis) and the overall readiness of the application.
Here’s a step-by-step breakdown of the example:
Node.js APP
- The application connects to MongoDB and Redis during startup.
- The application exposes a
/readyendpoint for the readiness probe. - When the
/readyendpoint is called, it performs the following checks:- Checks the connectivity to MongoDB by executing a ping command.
- Checks the connectivity to Redis by executing a ping command.
- If either of the checks fails, the
/readyendpoint returns a “Not Ready” status. - If both checks pass, the
/readyendpoint returns a “Ready” status.
- The application also exposes a
/hostnameendpoint that returns the hostname of the pod. We will use this endpoint to observe the pod traffic.
Deployment
- The
deployment.yamldefines deployments for the application, MongoDB, and Redis. - The application deployment includes a readiness probe that calls the
/readyendpoint periodically to check the application’s readiness. - Services are defined for MongoDB and Redis applications to enable communication between them.
Simulating Probe Failures
- We will simulate a failure scenario where the connectivity to Redis is lost:
- The Redis pod is deleted to simulate a failure.
- The readiness probe fails, and the application logs show Redis connection errors.
- The pod is removed from the service endpoints and has no new traffic.
- When the Redis pod is restored:
- The Redis connection is re-established.
- The readiness probe succeeds, and the application becomes ready.
- The pod is re-added to the service endpoint list.
- Traffic is reaching the pod.
- Navigate to
comprehensive-readiness-probedirectory.
cd comprehensive-readiness-probe- You can go through the
app.jsanddeployment.yamlto get a better understanding of the example app.
- Apply the deployment.
kubectl apply -f deployment.yaml- Verify that the Pod is running:
> POD=$(kubectl get pod -l app=comprehensive-readiness-probe -o jsonpath="{.items[0].metadata.name}")

> kubectl get pod/${POD}- Now that the pods are running, let’s confirm a few points we discussed earlier.
- Let’s check the service endpoints for each service.
> kubectl get endpoints

NAME                                    ENDPOINTS                           AGE
comprehensive-readiness-probe-service   10.244.0.69:3000,10.244.0.71:3000   2m34s
mongodb-service                         10.244.0.68:27017                   2m34s
redis-service 10.244.0.70:6379 2m34s- We can see two endpoints for
comprehensive-readiness-probe-serviceservice, i.e., two pods. - Let’s check the pod logs.
> kubectl logs $POD

Cache connection is active
Application is ready
Received readiness probe request
Database connection is active
Cache connection is active
Application is ready
Received readiness probe request
Database connection is active
Cache connection is active
Application is ready- To use the
/hostnameendpoint, we will use another awesome tool (one of my favorites), Netshoot.
kubectl run tmp-shell --rm -i --tty --image nicolaka/netshoot- Once the Netshoot container shell starts, execute the below curl request that will reach out to
app.jscontainer, returning the hostname of the pod.
while true; do curl http://comprehensive-readiness-probe-service/hostname && echo && sleep 1 ; done;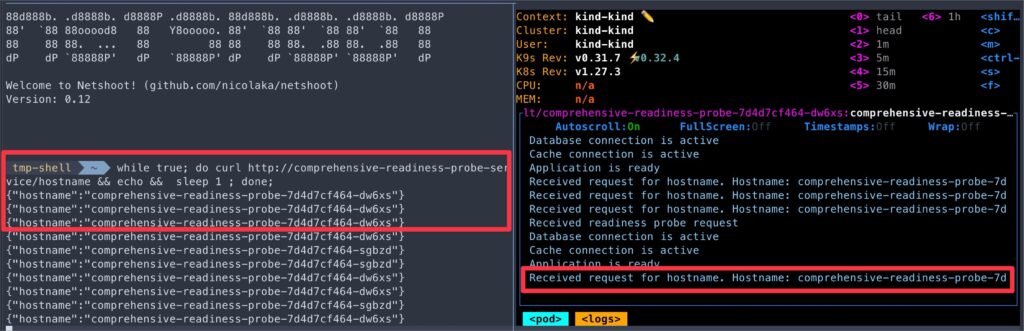
- Great. Now we have our setup ready, let’s make the
app.jspod unhealthy and observe what happens. - To fail the readiness probes, we’ll update the count of the Redis pod to 0.
kubectl scale deployment redis --replicas 0- As soon as the Redis connectivity is lost,
- You should see the connection failure errors on the pod logs.
- The pod events should report the readiness probe failures.
- The Netshoot curl request should also report connection errors.
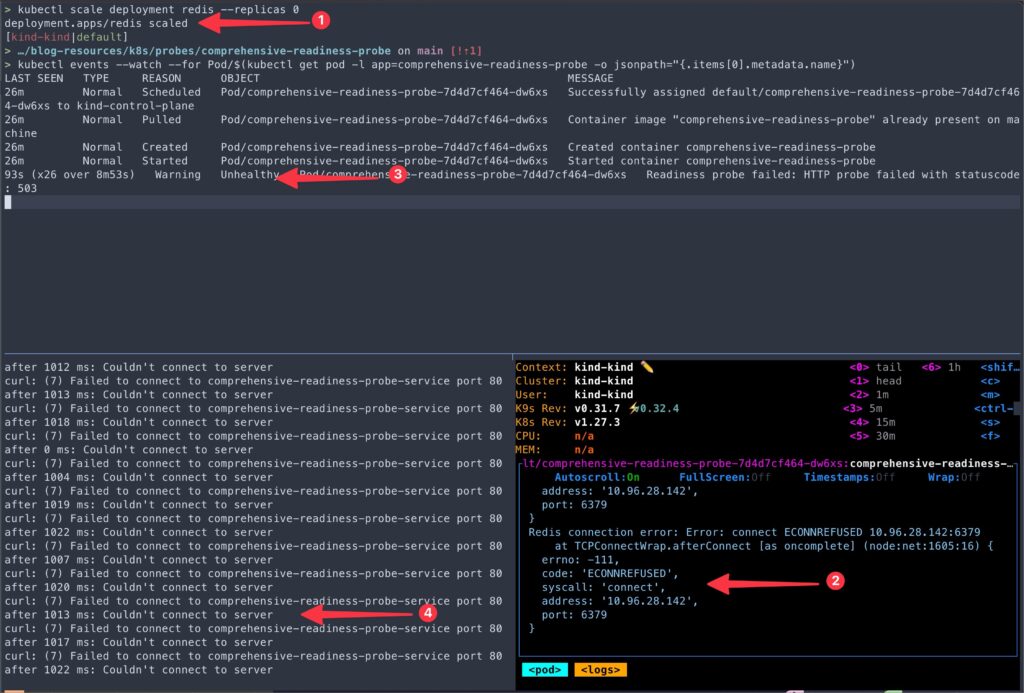
- Let’s look at why Netshoot curl is giving
Couldn’t connect to servererror.- If you look at the
comprehensive-readiness-probe-serviceendpoint, there is no endpoint present. - Since the pod is not passing its readiness probe, it’s removed from the service endpoint.
- If you look at the
> kubectl get endpoints comprehensive-readiness-probe-service

NAME                                    ENDPOINTS   AGE
comprehensive-readiness-probe-service               150m
But did you noticed it yet? Unlike liveness probe failures, even after numerous readiness probe failures, the container is still not restarted.
> kubectl get pod -l app=comprehensive-readiness-probe

NAME                                             READY   STATUS    RESTARTS   AGE
comprehensive-readiness-probe-7d4d7cf464-dw6xs   0/1     Running   0          146m
comprehensive-readiness-probe-7d4d7cf464-sgbzd 0/1 Running 0 146m- Now, let’s restore the Redis pod and observe the curl running in the Netshoot container.
kubectl scale deployment redis --replicas 1- Once the Redis pod starts, the
/readyprobes can reach the Redis endpoint,- The
app.jspod error should be resolved. - The Netshoot curl should return the hostname of the pods correctly.
comprehensive-readiness-probe-serviceendpoint should have both pods’ endpoints.
- The
> kubectl get endpoints comprehensive-readiness-probe-service

NAME                                    ENDPOINTS                           AGE
comprehensive-readiness-probe-service   10.244.0.69:3000,10.244.0.71:3000   155m
The key takeaways from this example are:
- By implementing a readiness probe, you can prevent traffic from being sent to pods that are not fully ready or have issues with their dependencies.
- When a dependency fails, the readiness probe fails, and Kubernetes stops sending traffic to the affected pods until the issue is resolved.
- The readiness probe will succeed once the dependencies are restored, and pod traffic will resume.
Example of Startup Probe
Example 5: Startup Probe with Liveness and Readiness Probes
In this example, we’ll create a Node.js application that simulates a long startup process and configure a startup probe, liveness, and readiness probes to demonstrate their behavior.
- Navigate to the
startup-probe-exampledirectory.
cd startup-probe-example- In this example application:
- The
/readyendpoint remains the same, handling the readiness probe. - The
/healthzendpoint remains the same, handling the liveness probe. - A new
/startupendpoint is added to handle the startup probe. It returns a 200 status code if the application has started successfully and a 503 status code if the application is still starting up. - The application simulates a startup delay based on the
STARTUP_DELAYenvironment variable (default is 30 seconds).
- The
- In
deployment.yaml,- The startup probe allows the container to start up and initialize for up to 30 failures with a 5-second interval between each probe.
- Once the startup probe succeeds, the liveness and readiness probes should take over, checking the health and readiness of the container every 5 seconds, with an initial delay of 10 seconds.
- Apply the deployment.
kubectl apply -f deployment.yaml- Verify that the Pod is running:
> POD=$(kubectl get pod -l app=startup-probe-example -o jsonpath="{.items[0].metadata.name}")

> kubectl get pod/${POD}- Now, let’s observe the pod logs.
kubectl logs -f $POD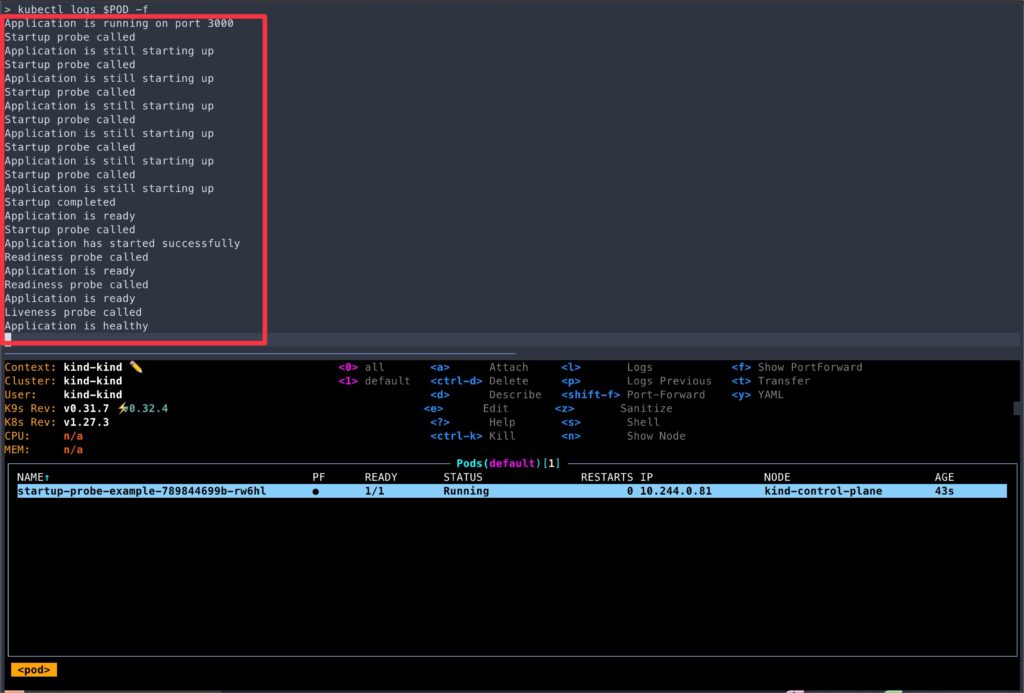
- A few points to note from logs,
- Despite having
initialDelaySecondsof 10 seconds, the readiness and liveness probes were not active until the startup probe succeeded. - You can test this behavior by commenting out the startup probe section from
deployment.yamland re-applying it. - If you reduced
failureThresholdto just 1, the container will keep restarting due to startup probe failures.
- Despite having
As we learned earlier, in scenarios where your application has a prolonged startup process, using a startup probe in combination with liveness and readiness probes ensures that the application is given sufficient time to initialize while still being monitored for health and readiness.
Finetuning Probes
While the default probe settings provide a good starting point, there may be situations where you need to fine-tune the probe parameters to suit your application’s specific requirements better.
Fine-tuning your probes allows you to:
- Avoid unnecessary container restarts or traffic disruptions
- Ensure your application is truly ready to serve traffic
- Optimize probe frequency and timeout values
- Handle application startup and shutdown gracefully
We have already used a couple of these parameters in the above examples. Here is a quick summary of the rest of the parameters you can adjust to fine-tune your probes:
Conclusion
Throughout this article, we explored the different types of probes and their use cases. Using practical examples, we learned how to configure probes and saw how Kubernetes responds to probe failures by restarting containers or stopping traffic to unhealthy pods.
Remember, probes are not limited to HTTP, TCP, or command-based checks. Kubernetes also supports gRPC probes, allowing you to leverage the gRPC Health Checking Protocol for more advanced health monitoring scenarios.
I encourage you to experiment with different probe configurations and explore how they can improve the reliability and scalability of your applications. Test various failure scenarios, monitor probe behavior, and iterate on your configurations to find the optimal settings for your use case.
🙏 Thanks for your time and attention all the way through!
Till we meet again, keep making waves.🌊 🚀